5.6. Profiling Mem
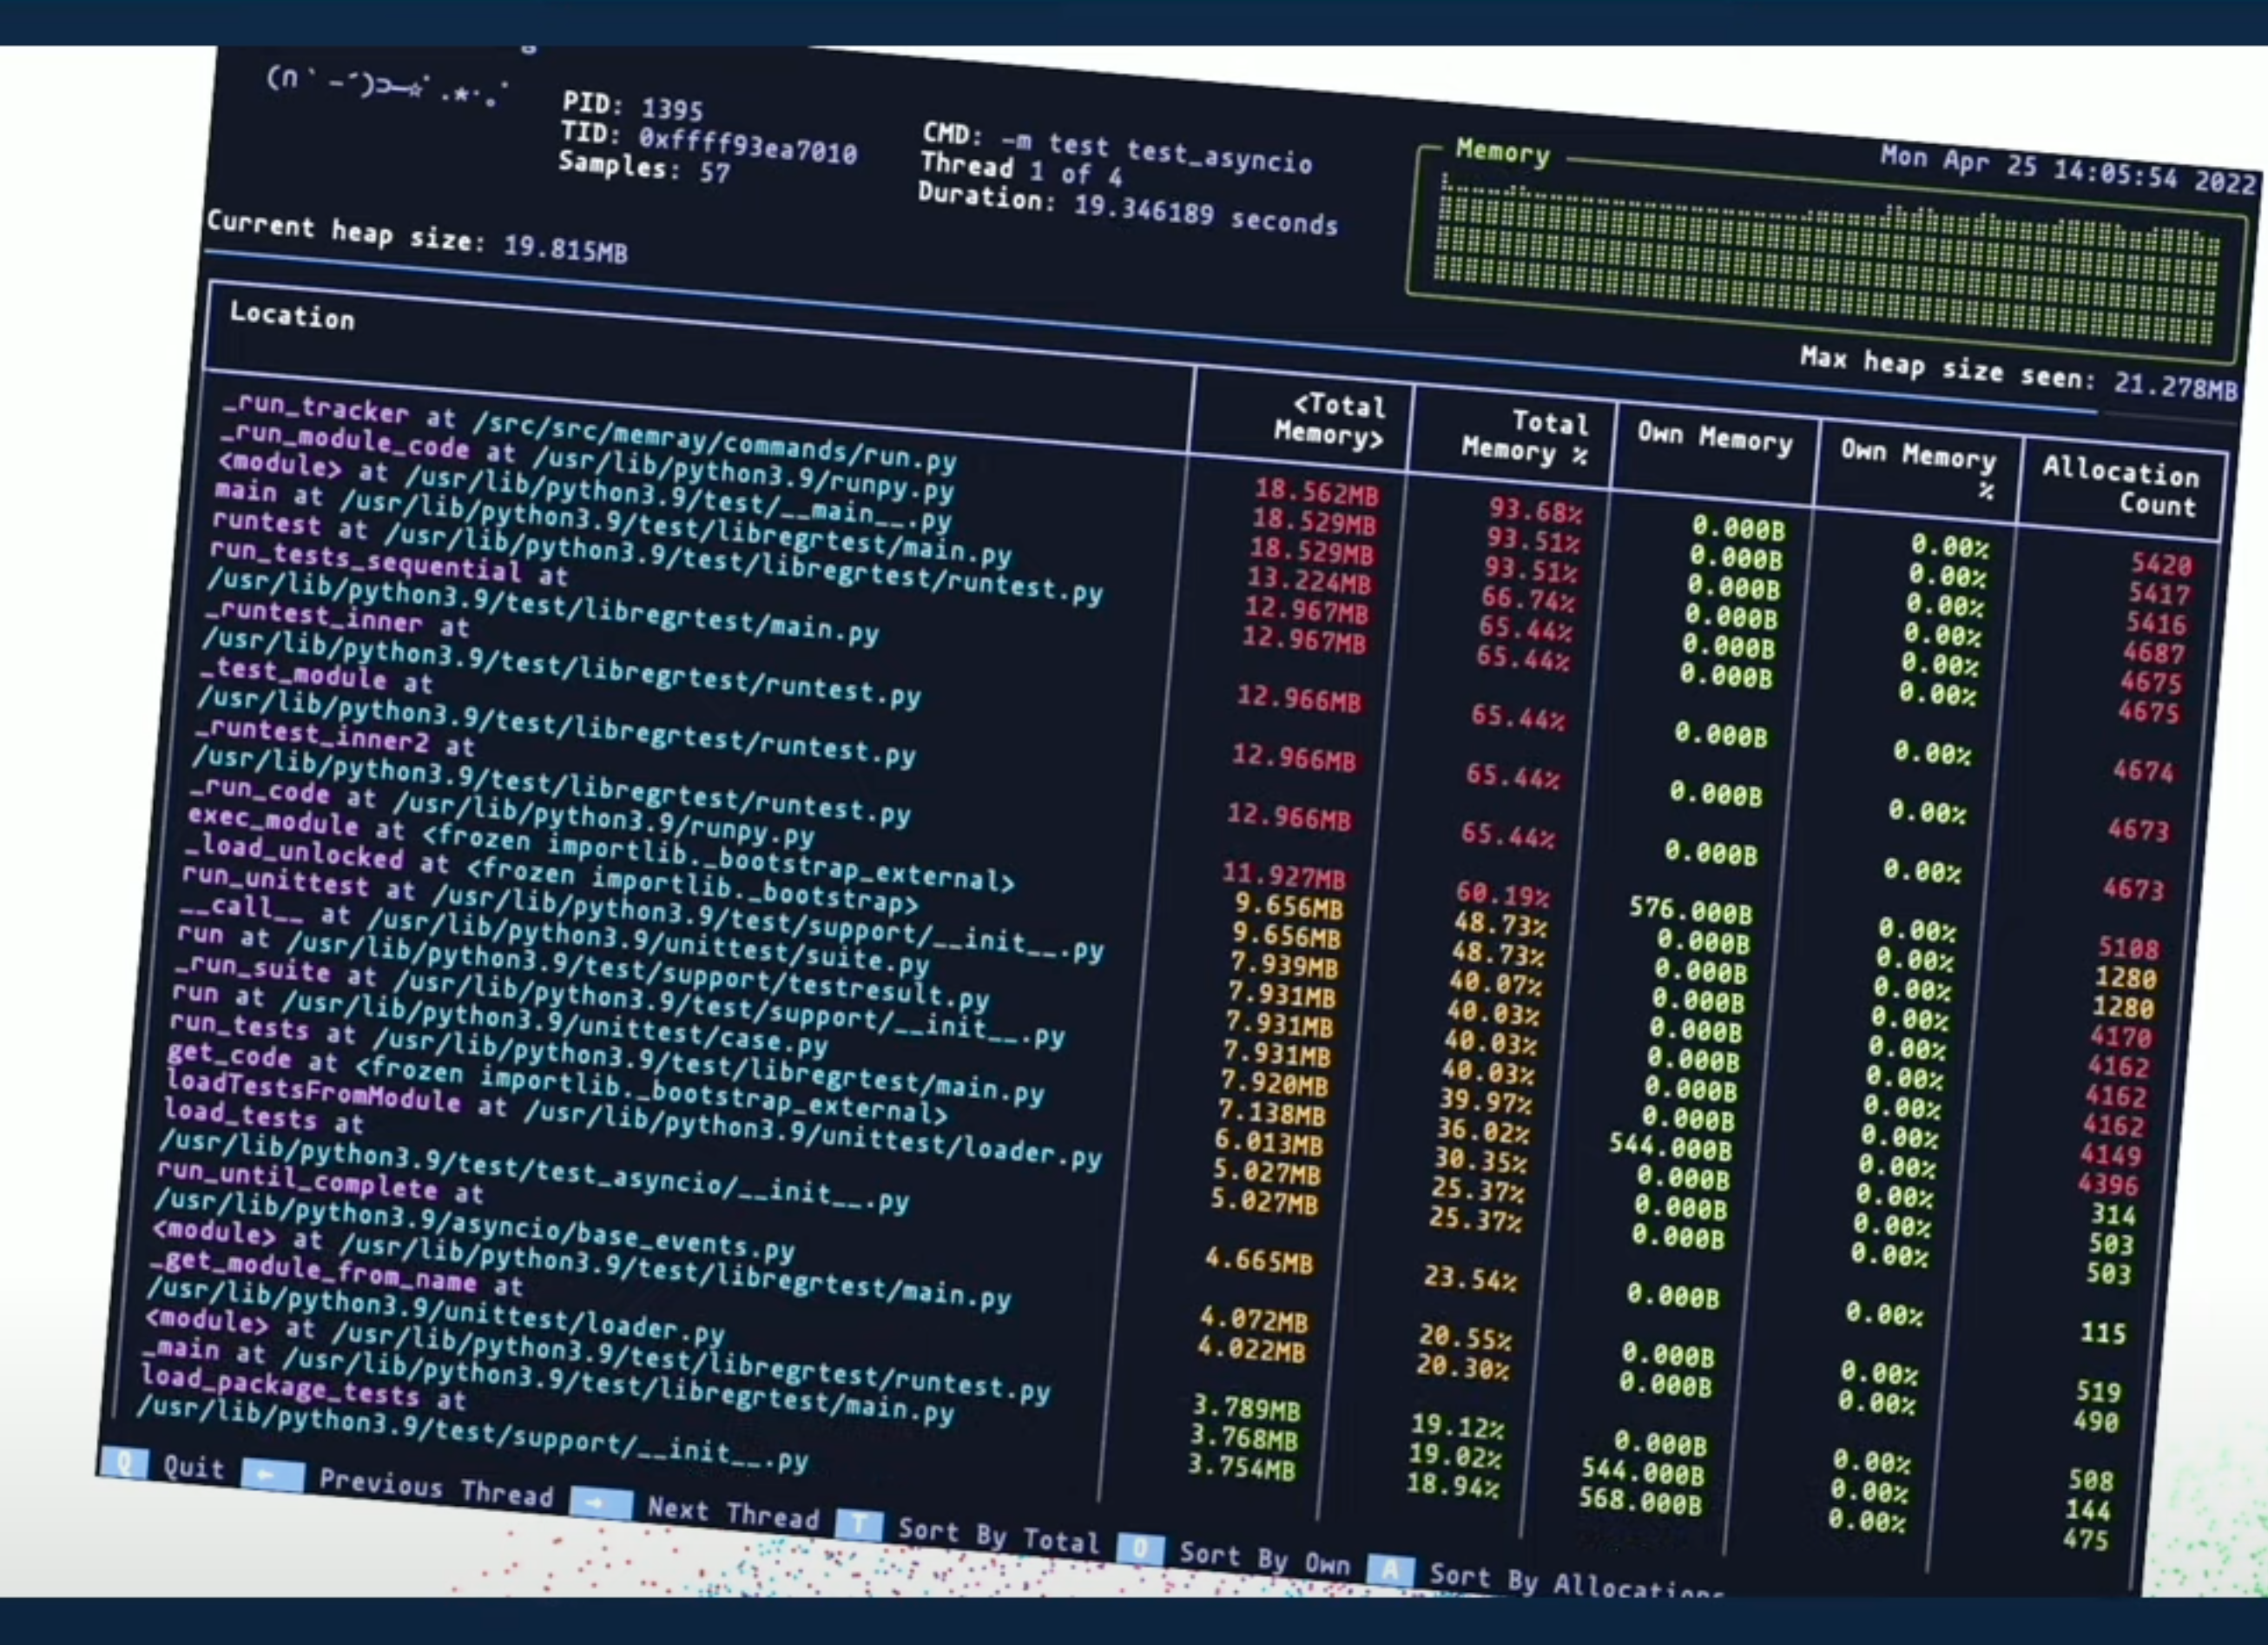
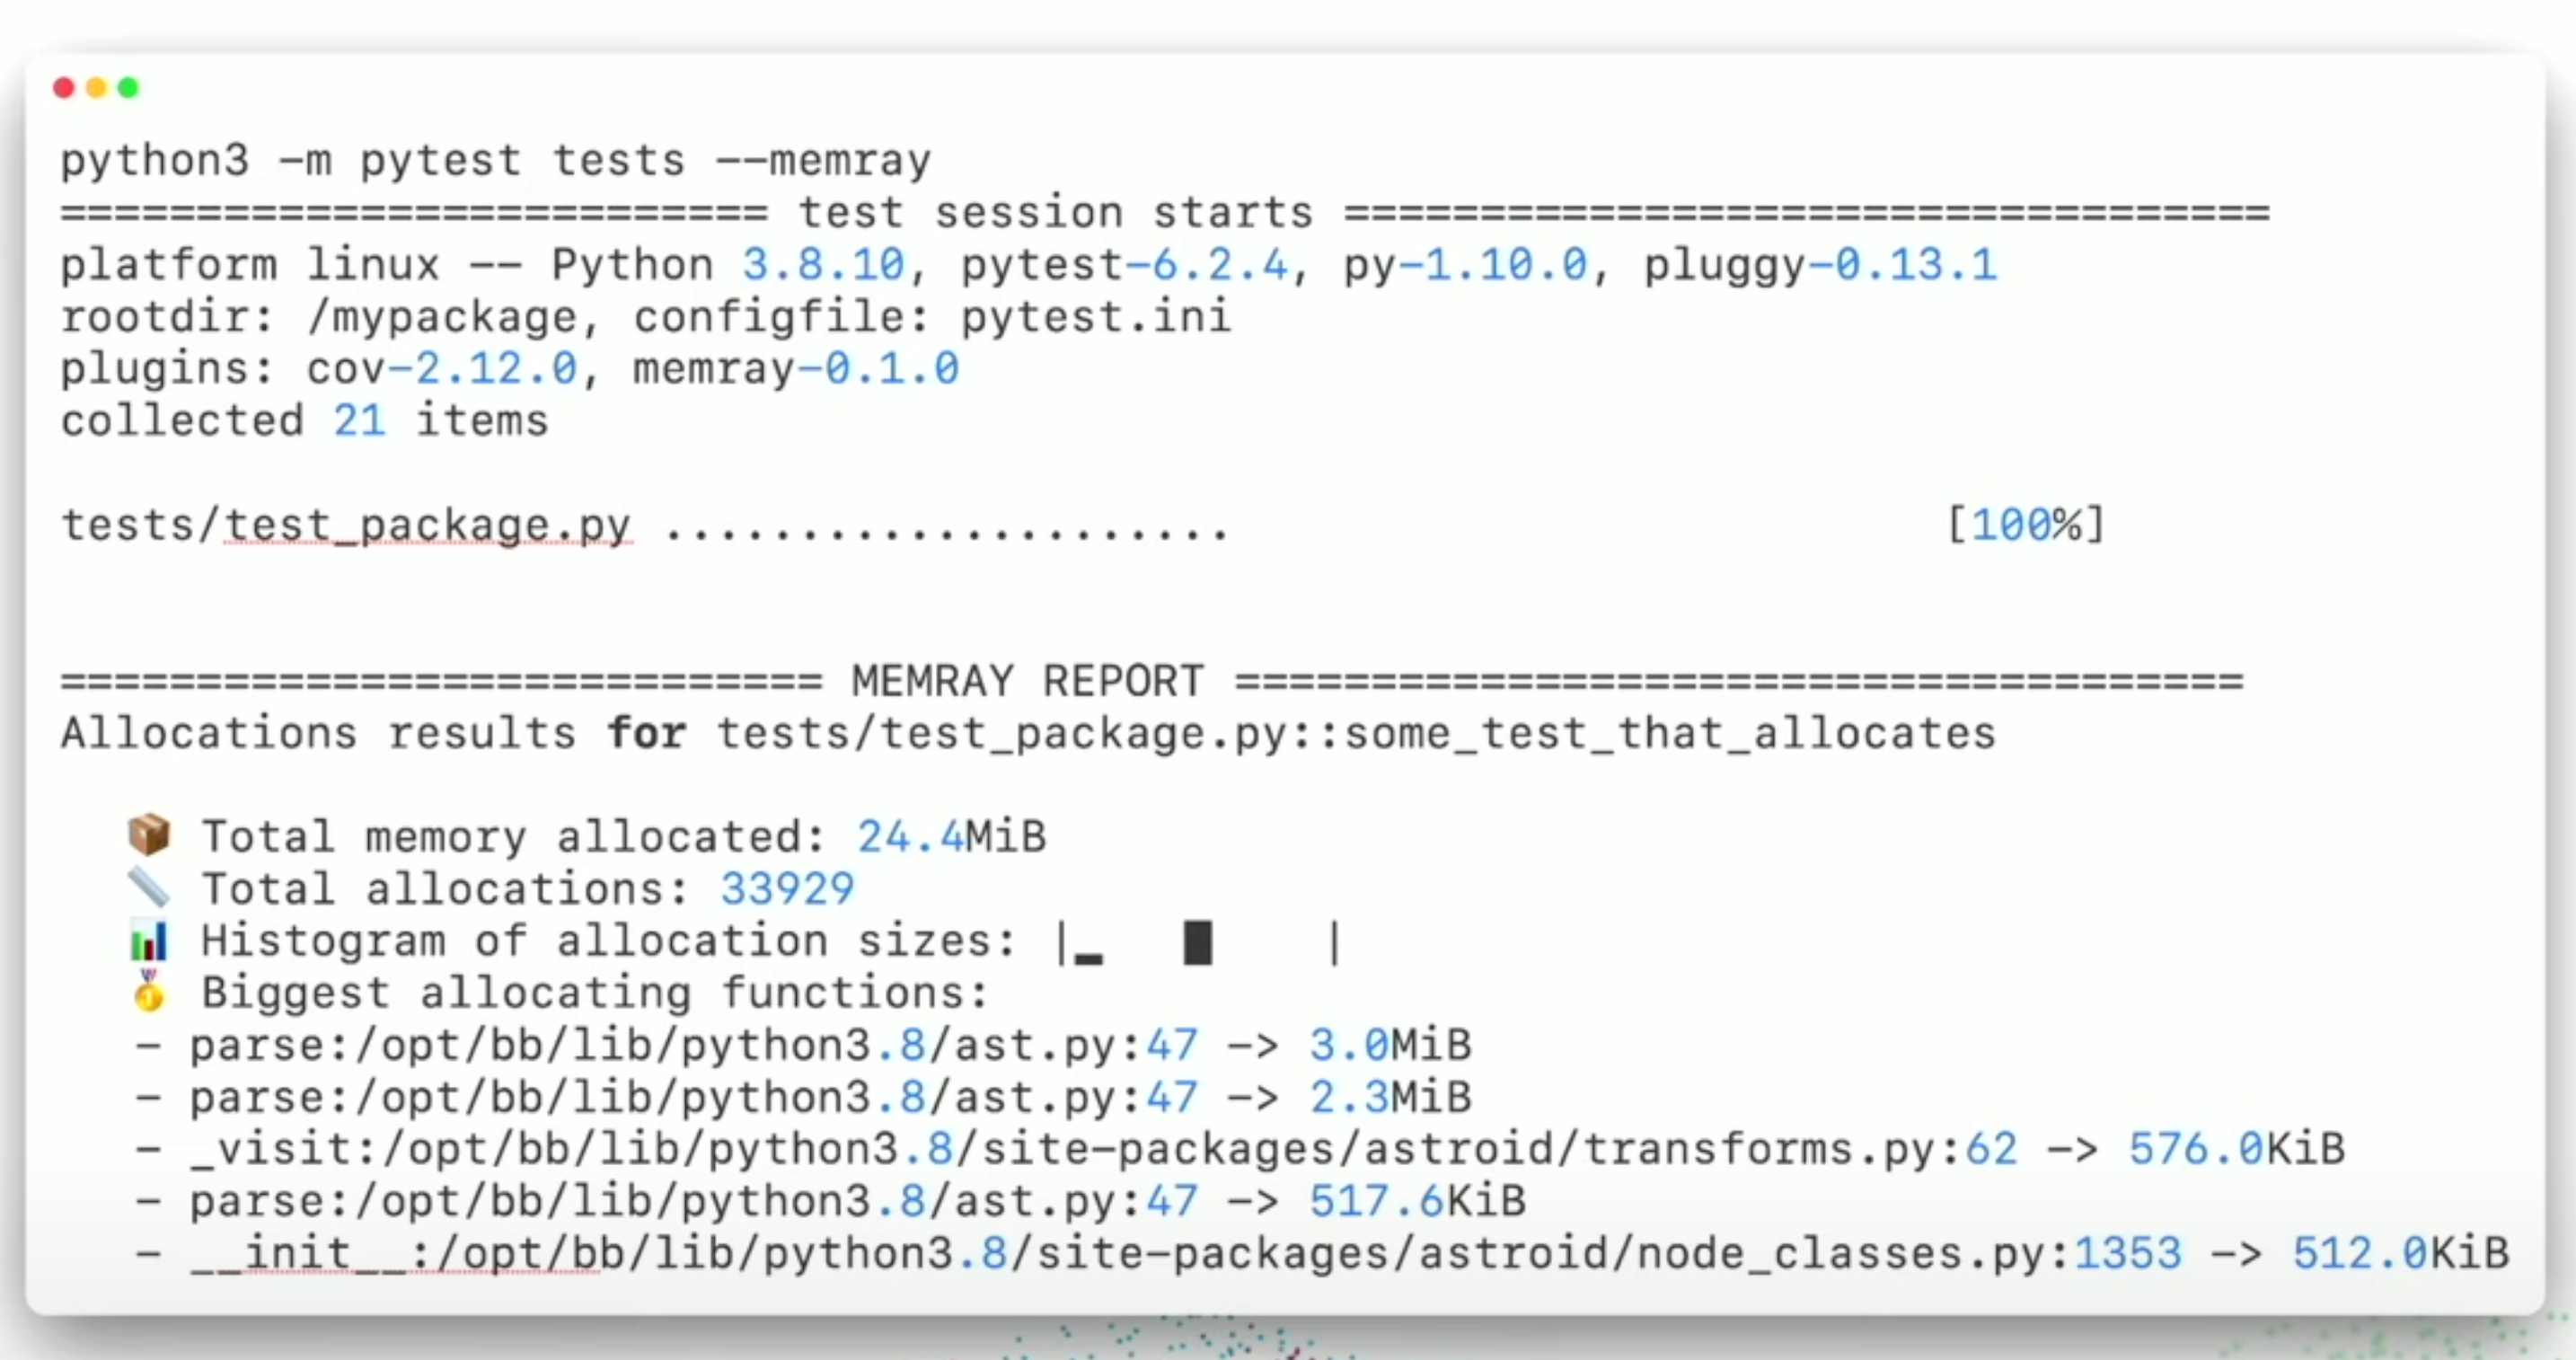
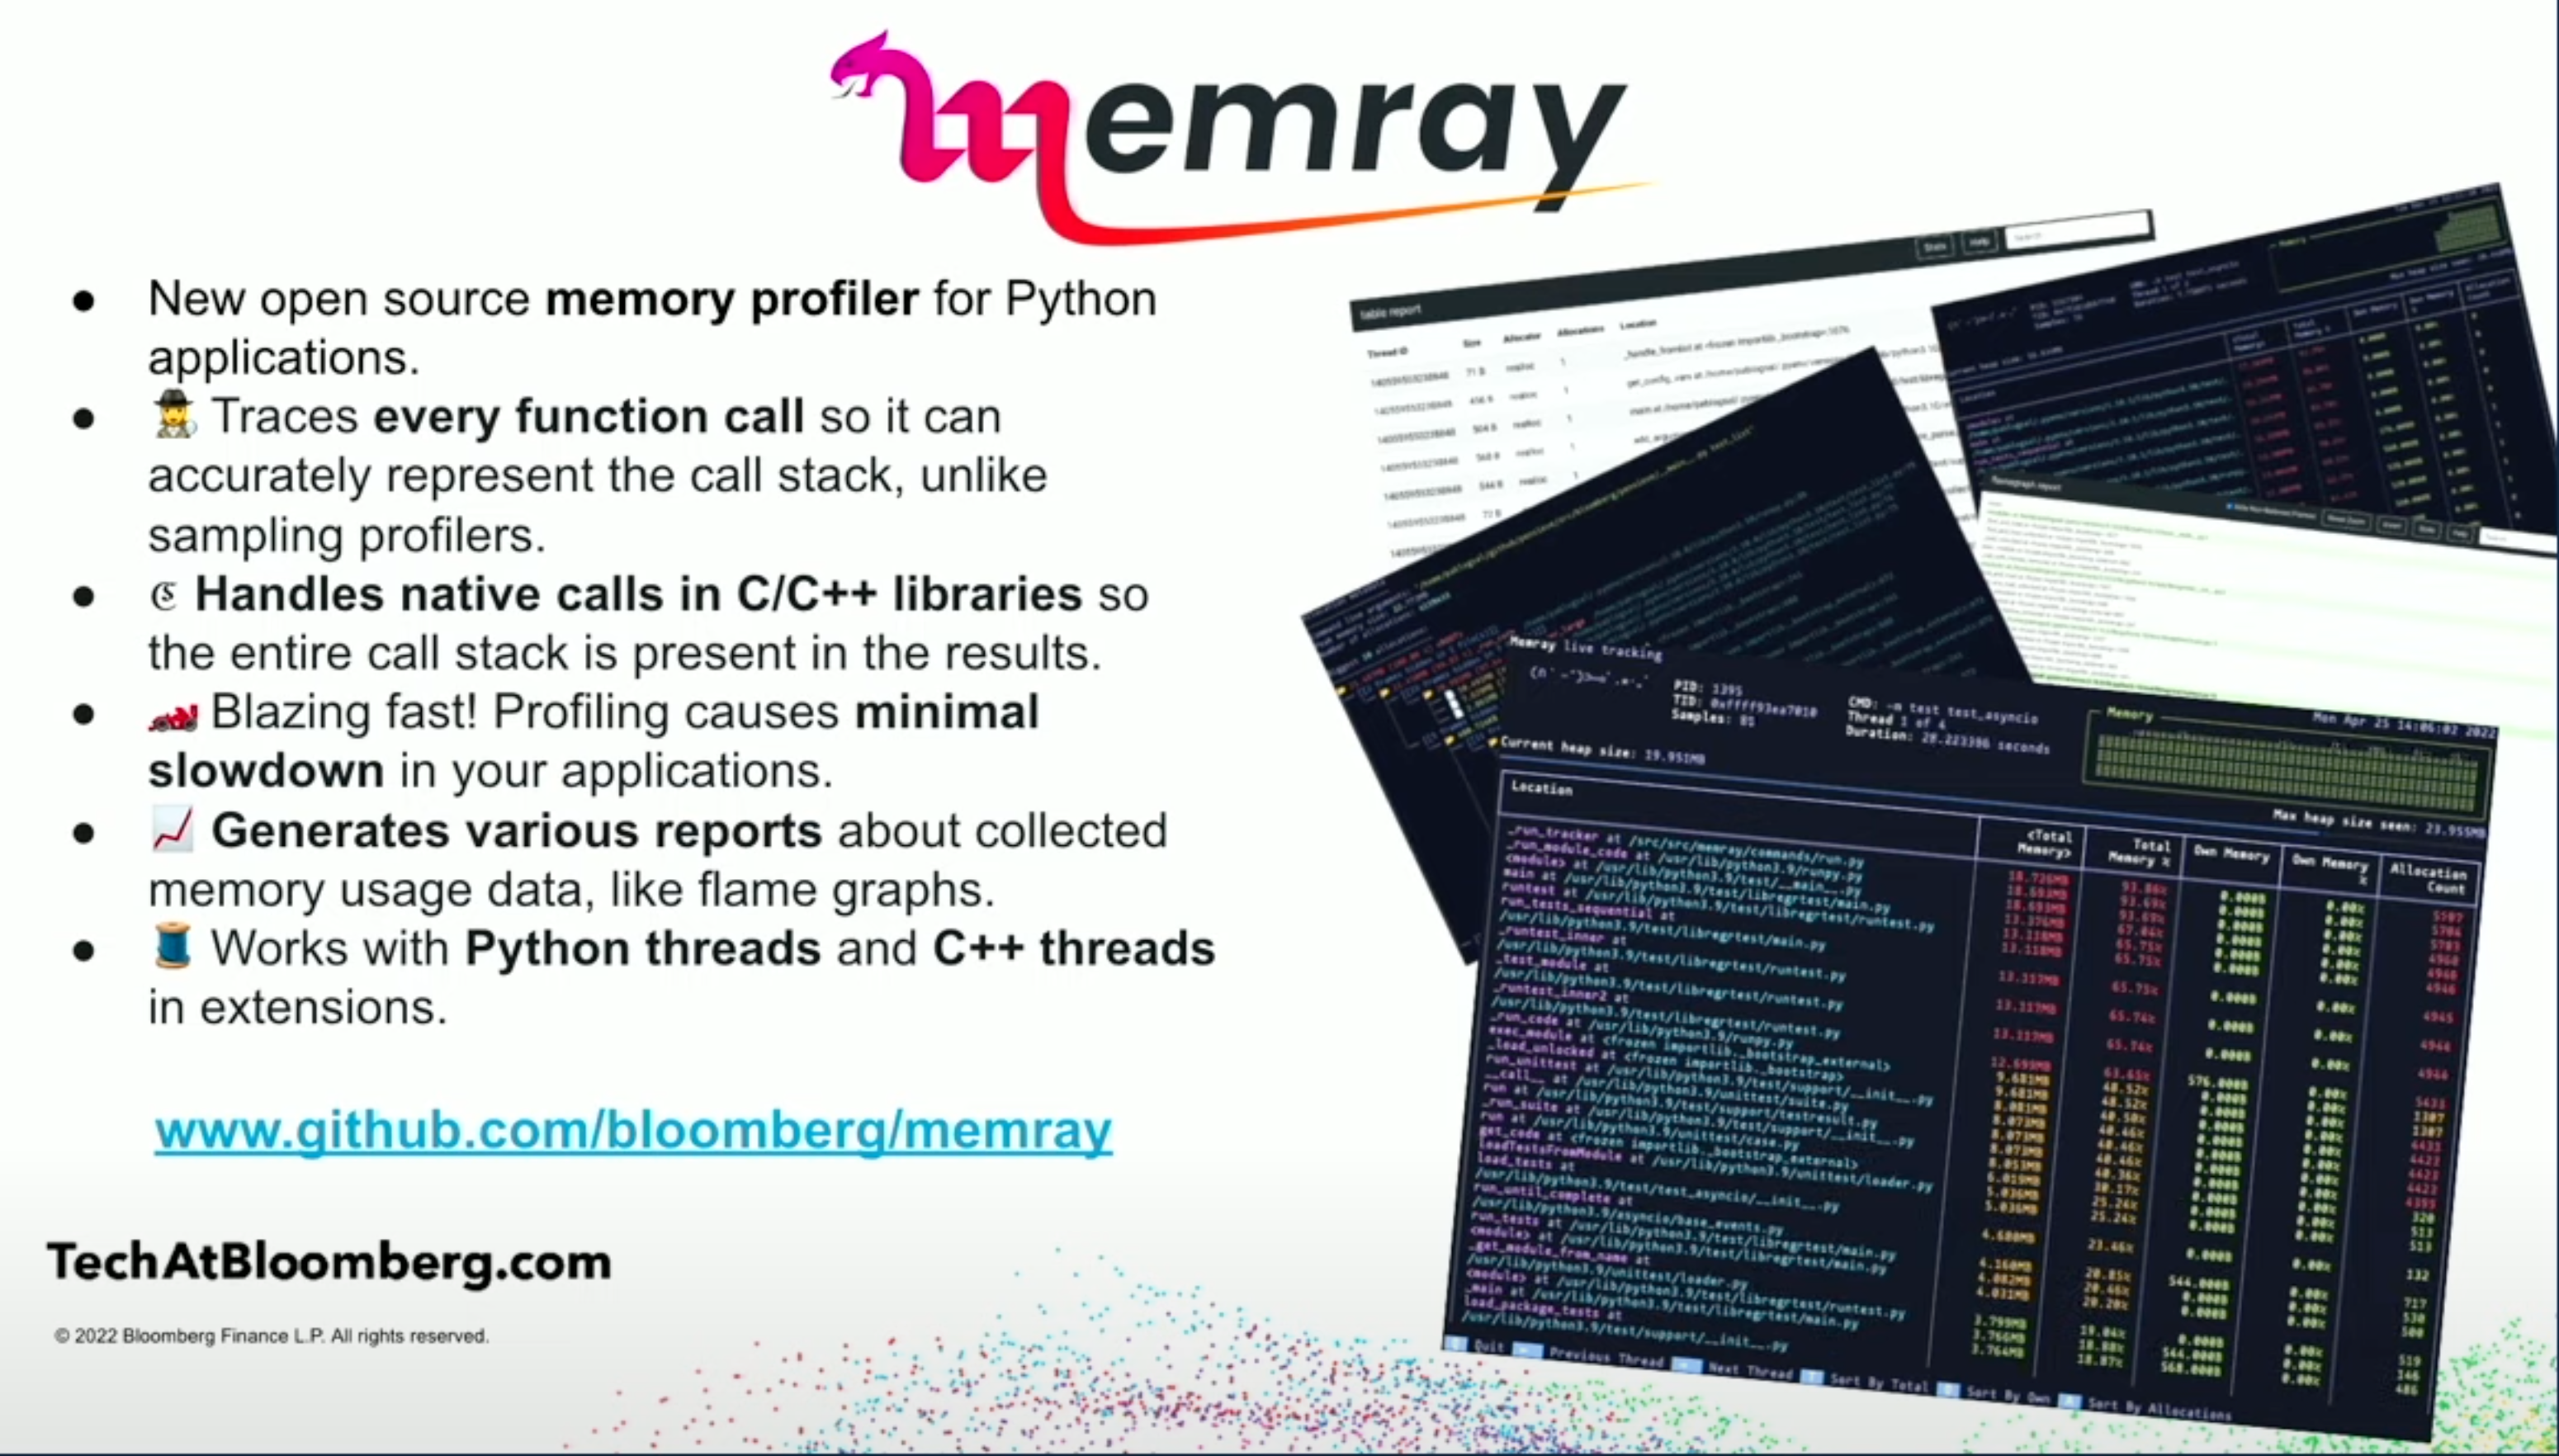
5.6.1. Memray
Works only on Linux and macOS
Does not work on Windows
https://podcasts.apple.com/us/podcast/episode-21-a-garbage-episode/id1712665877?i=1000703862922
https://podcasts.apple.com/us/podcast/episode-16-memory-allocation/id1712665877?i=1000674933579
$ python -m pip install memray
$ python -m memray run myfile.py
$ python -m memray summary memray-orig.py.59092.bin
$ python -m memray tree memray-orig.py.59092.bin
$ python -m memray flamegraph memray-orig.py.59092.bin
$ python -m memray table memray-orig.py.59092.bin
$ python -m memray stats memray-orig.py.59092.bin
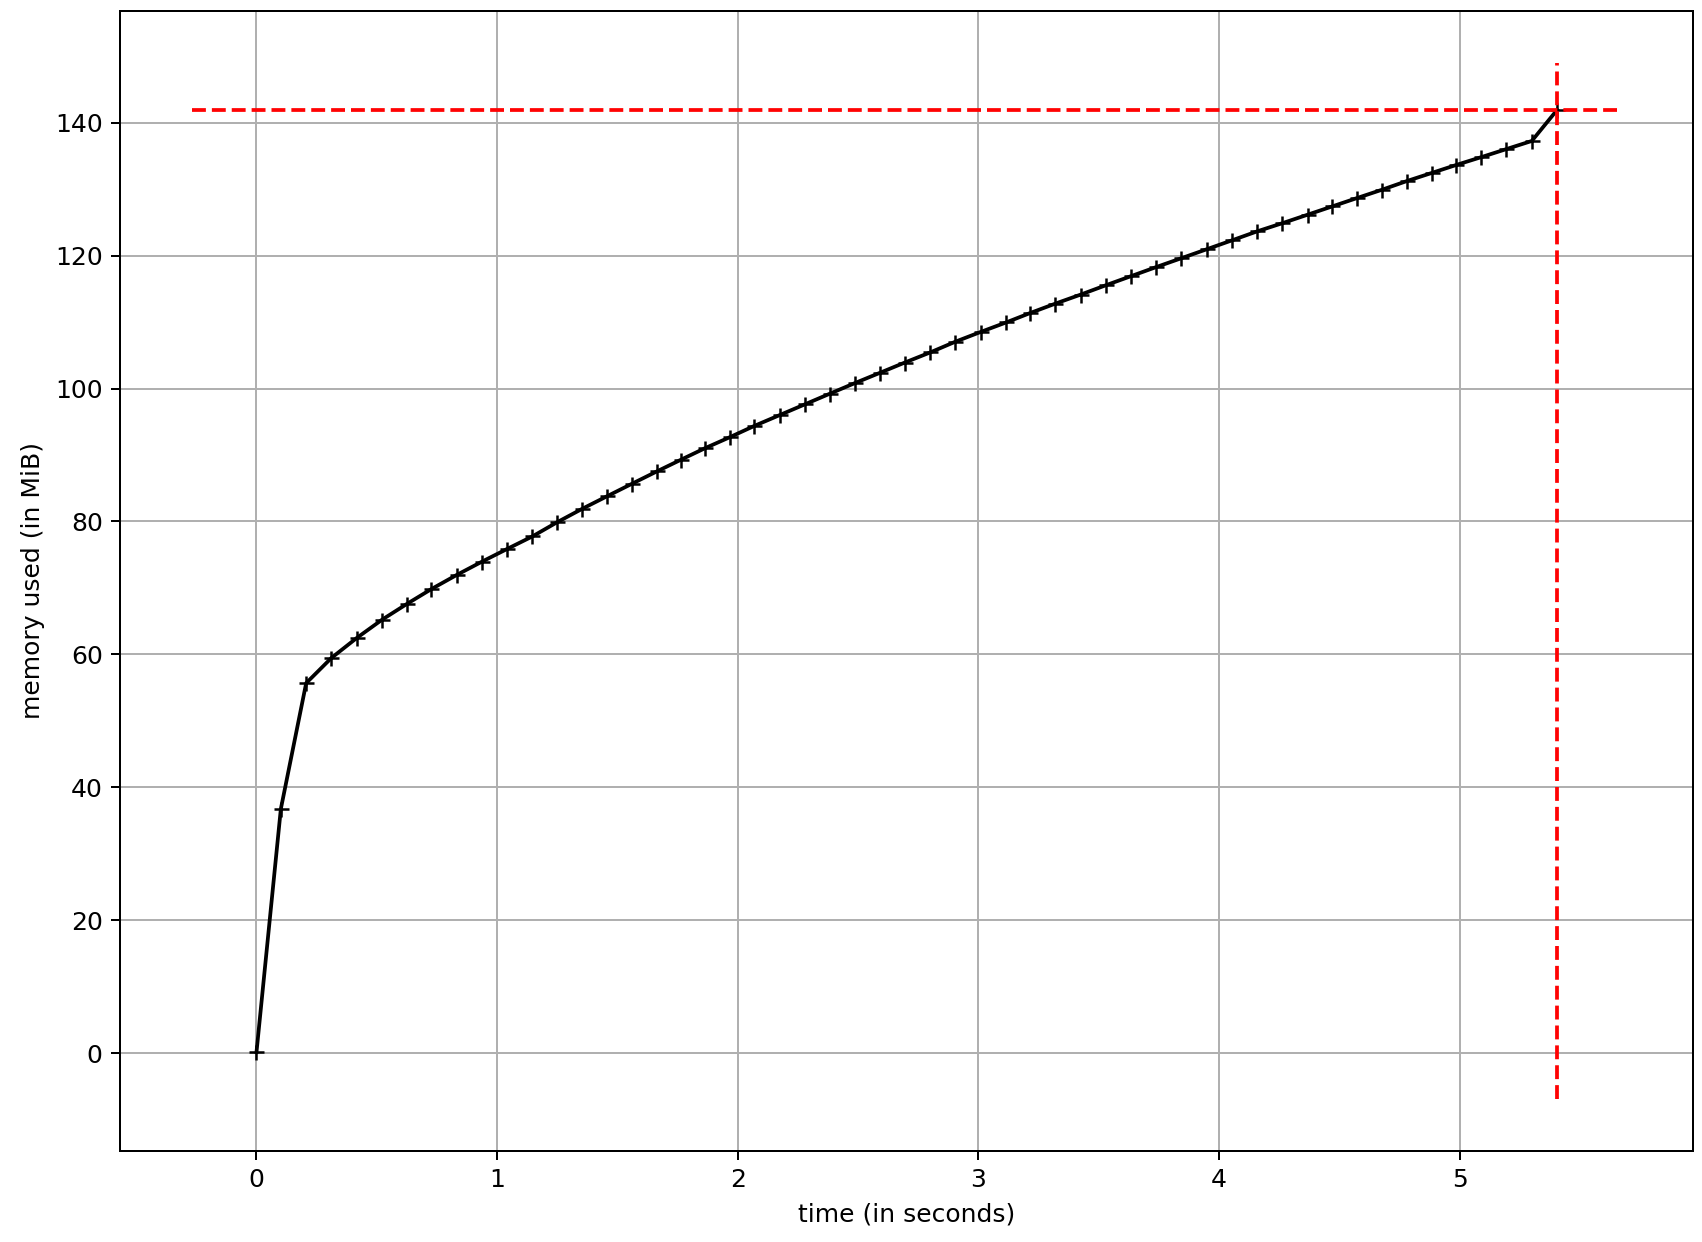
5.6.2. Memory Profiler
Memory Profiler is a Python module for monitoring memory consumption of a process as well as line-by-line analysis of memory consumption for Python programs.
python -m pip install memory-profilerpython -m memory_profiler myfile.pyfrom memory_profiler import profile, memory_usage@profileusage = memory_usage((func, (arg1, arg2), {'kwarg1': 'val'}))python -m mprof run myfile.pypython -m mprof plot- requiresmatplotlibto run
Install:
$ python -m pip install memory-profiler matplotlib
Use Case 1:
def run():
    [x**x for x in range(0,10_000)]

run()
$ python -m mprof run myfile.py
$ python -m mprof plot
Use Case 2:
from memory_profiler import profile, memory_usage

@profile
def run():
    [x**x for x in range(0,10_000)]

usage = memory_usage((run, (), {}))
$ python -m memory_profiler myfile.py